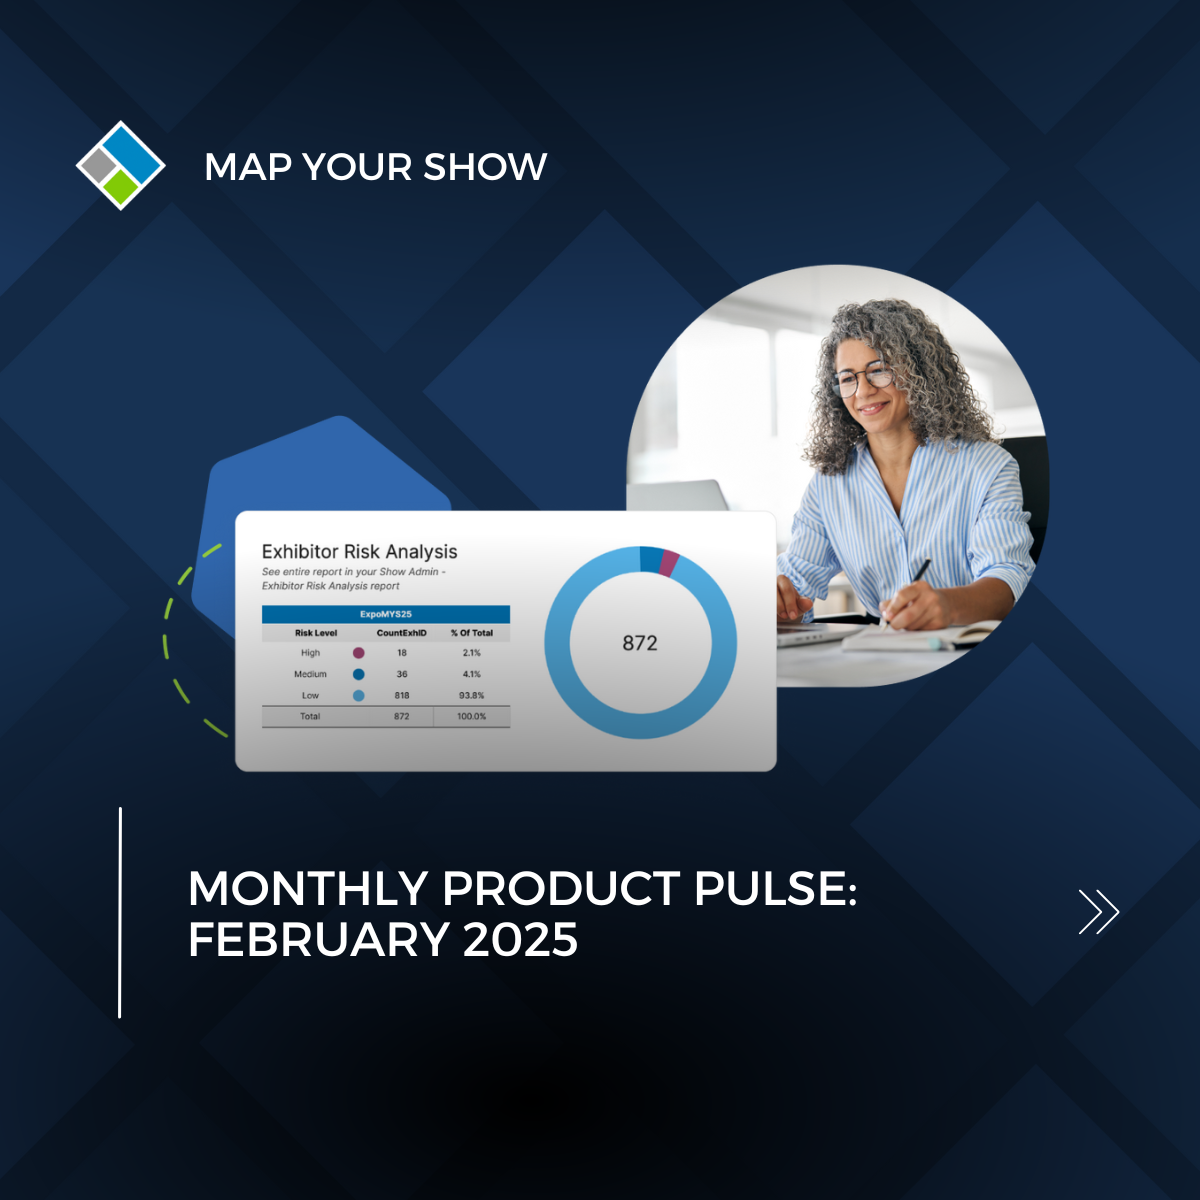
Improve Financial Performance With MYS Insights
MYS Insights uses data science and machine learning to analyze historical data from previous show cycles and evaluate critical performance metrics such as revenue pacing, booth space sales, pricing trends and exhibitor retention.
With the Exhibitor Risk Analysis tool you can identify exhibitors at risk of not renewing and take action to enhance renewal and retention rates.
With MYS Insights, your team can predict trends and revenue, address potential risks, and make strategic decisions to improve the show's financial outcomes and revenue targets.
.png?width=491&height=456&name=01%20(1).png)
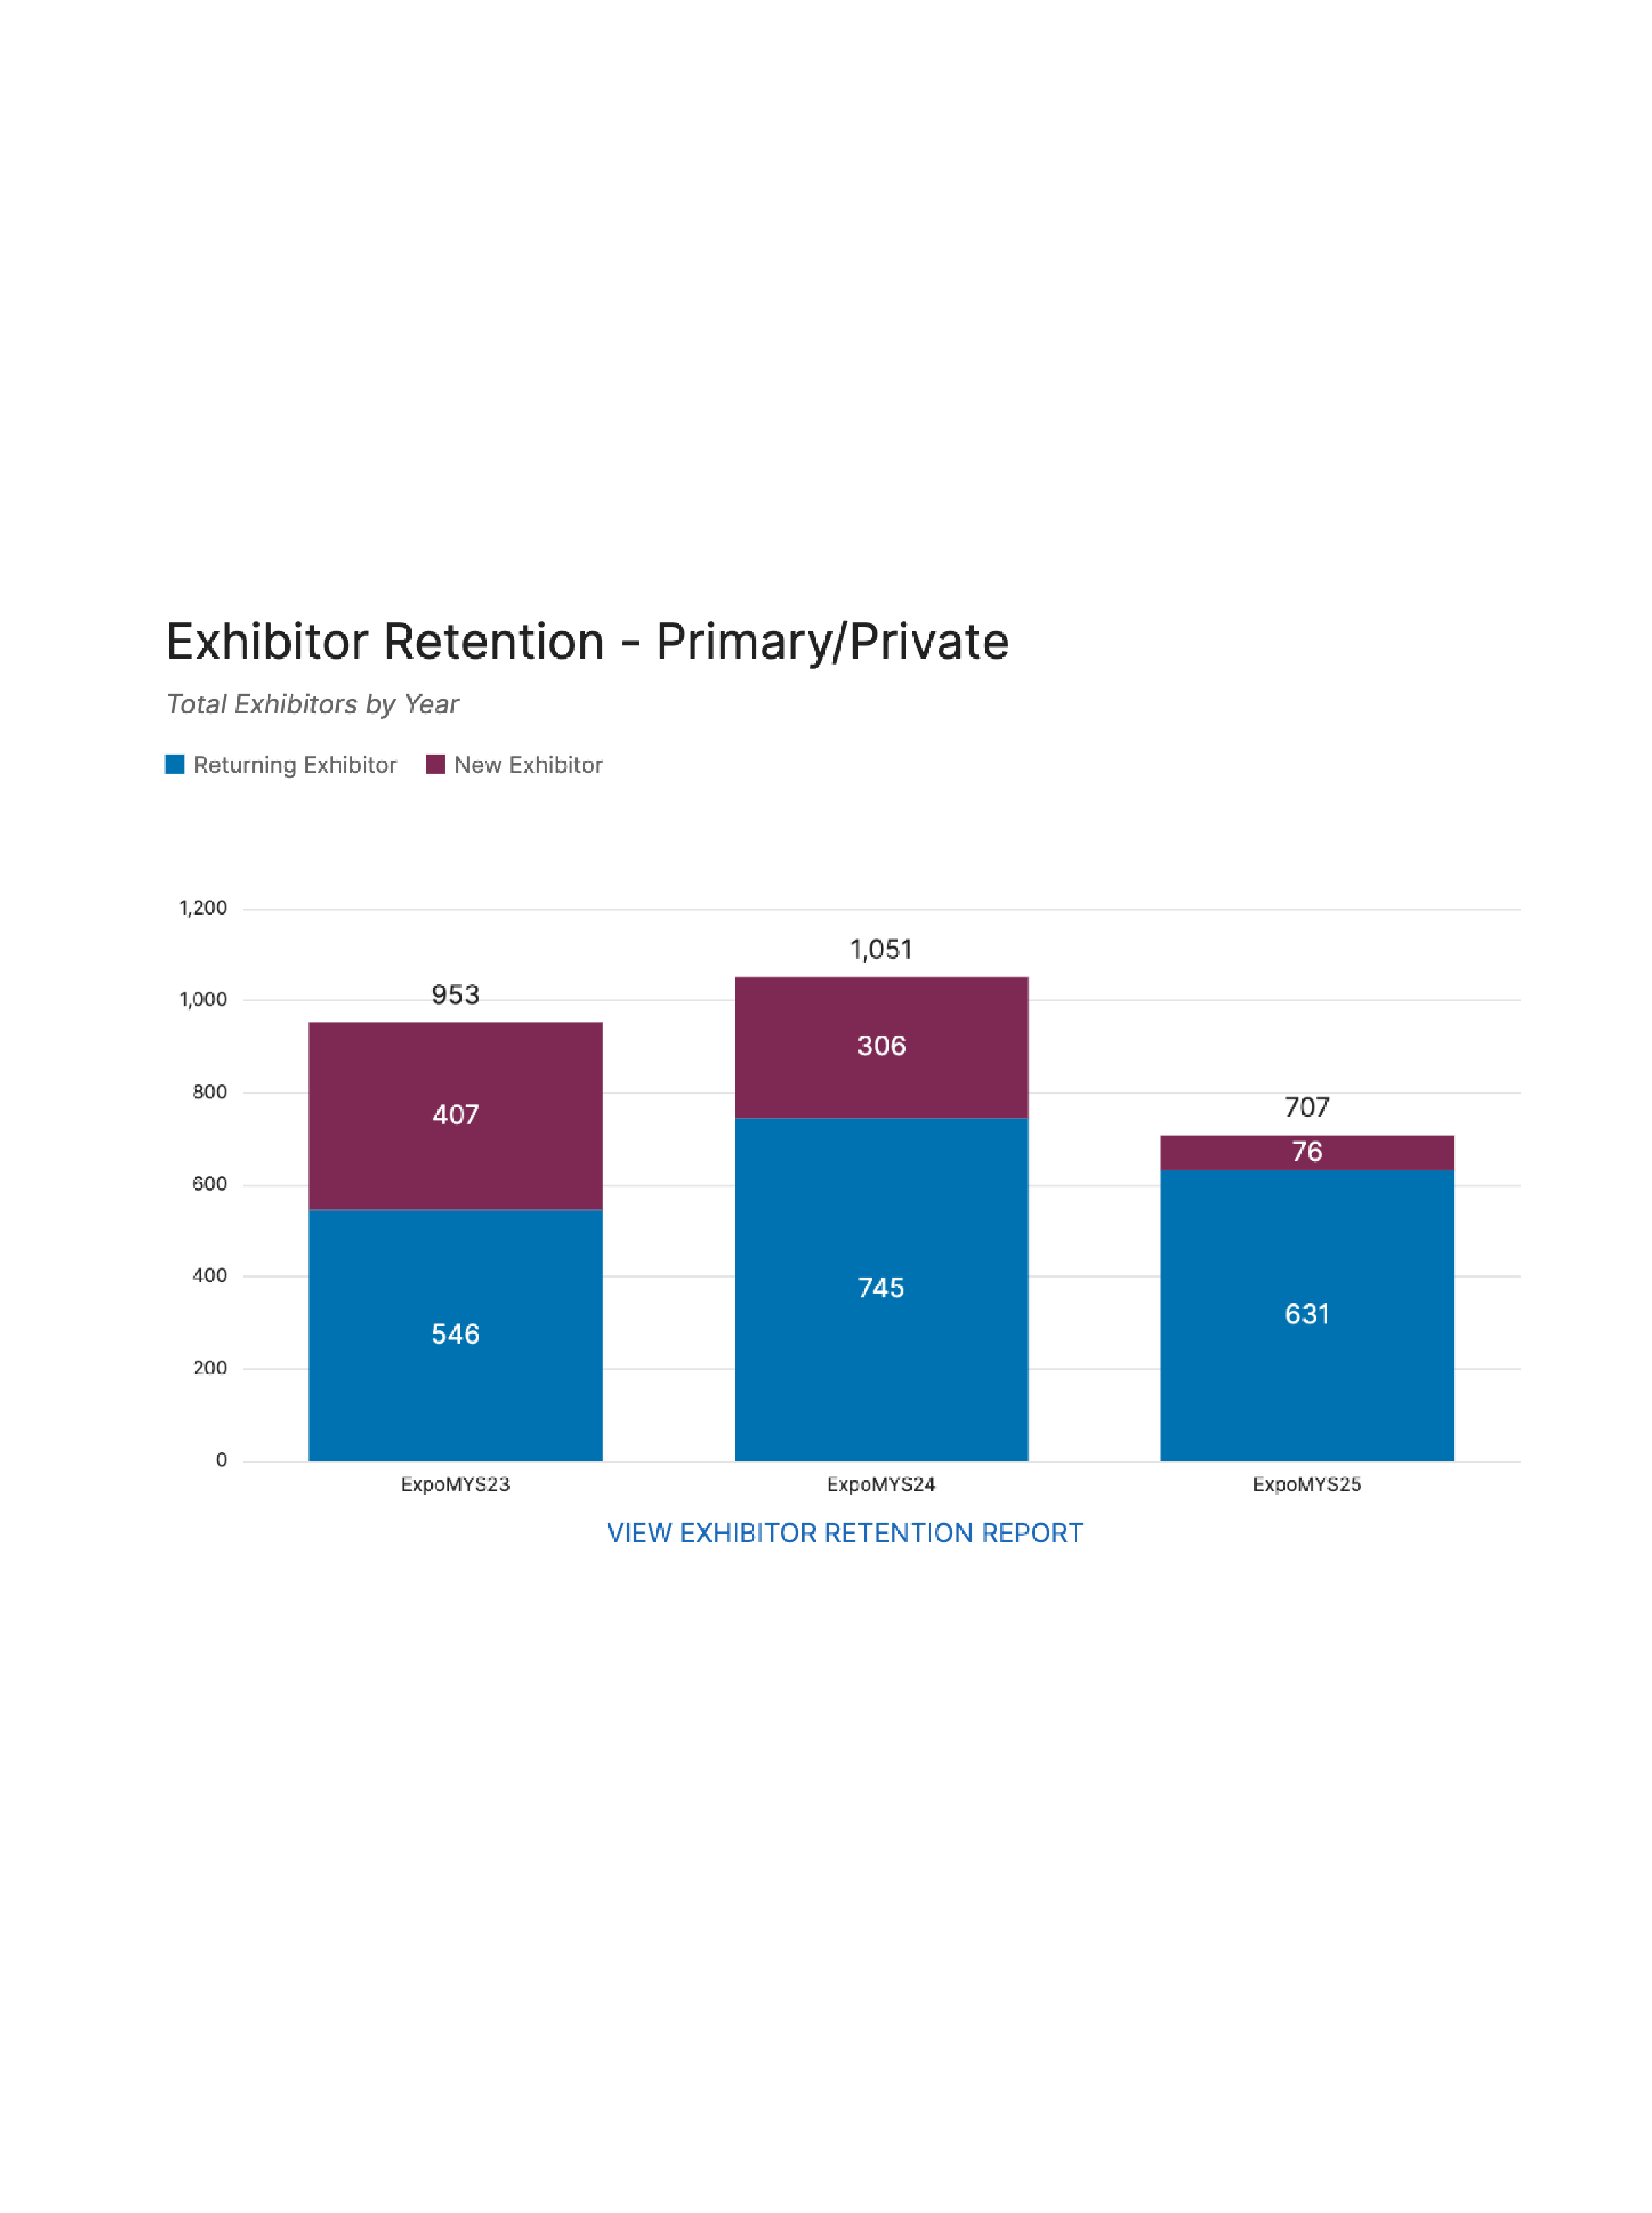
Exhibitor Risk Analysis
The Exhibitor Risk Analysis uses on-platform exhibitor behavioral data to identify exhibitors at risk of not renewing. This report categorizes each exhibitor, indicating their level of renewal risk.

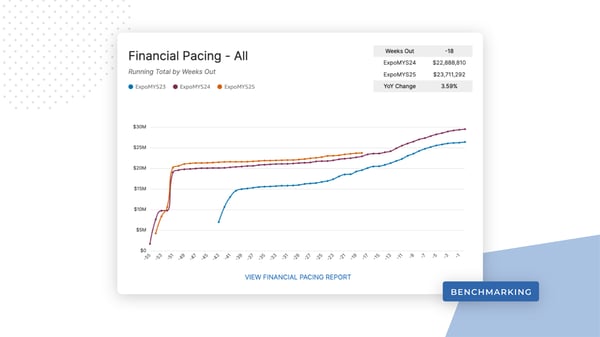
Benchmarking
See how your event performance compares to a cohort of shows with a similar exhibitor count and pinpoint areas for growth.
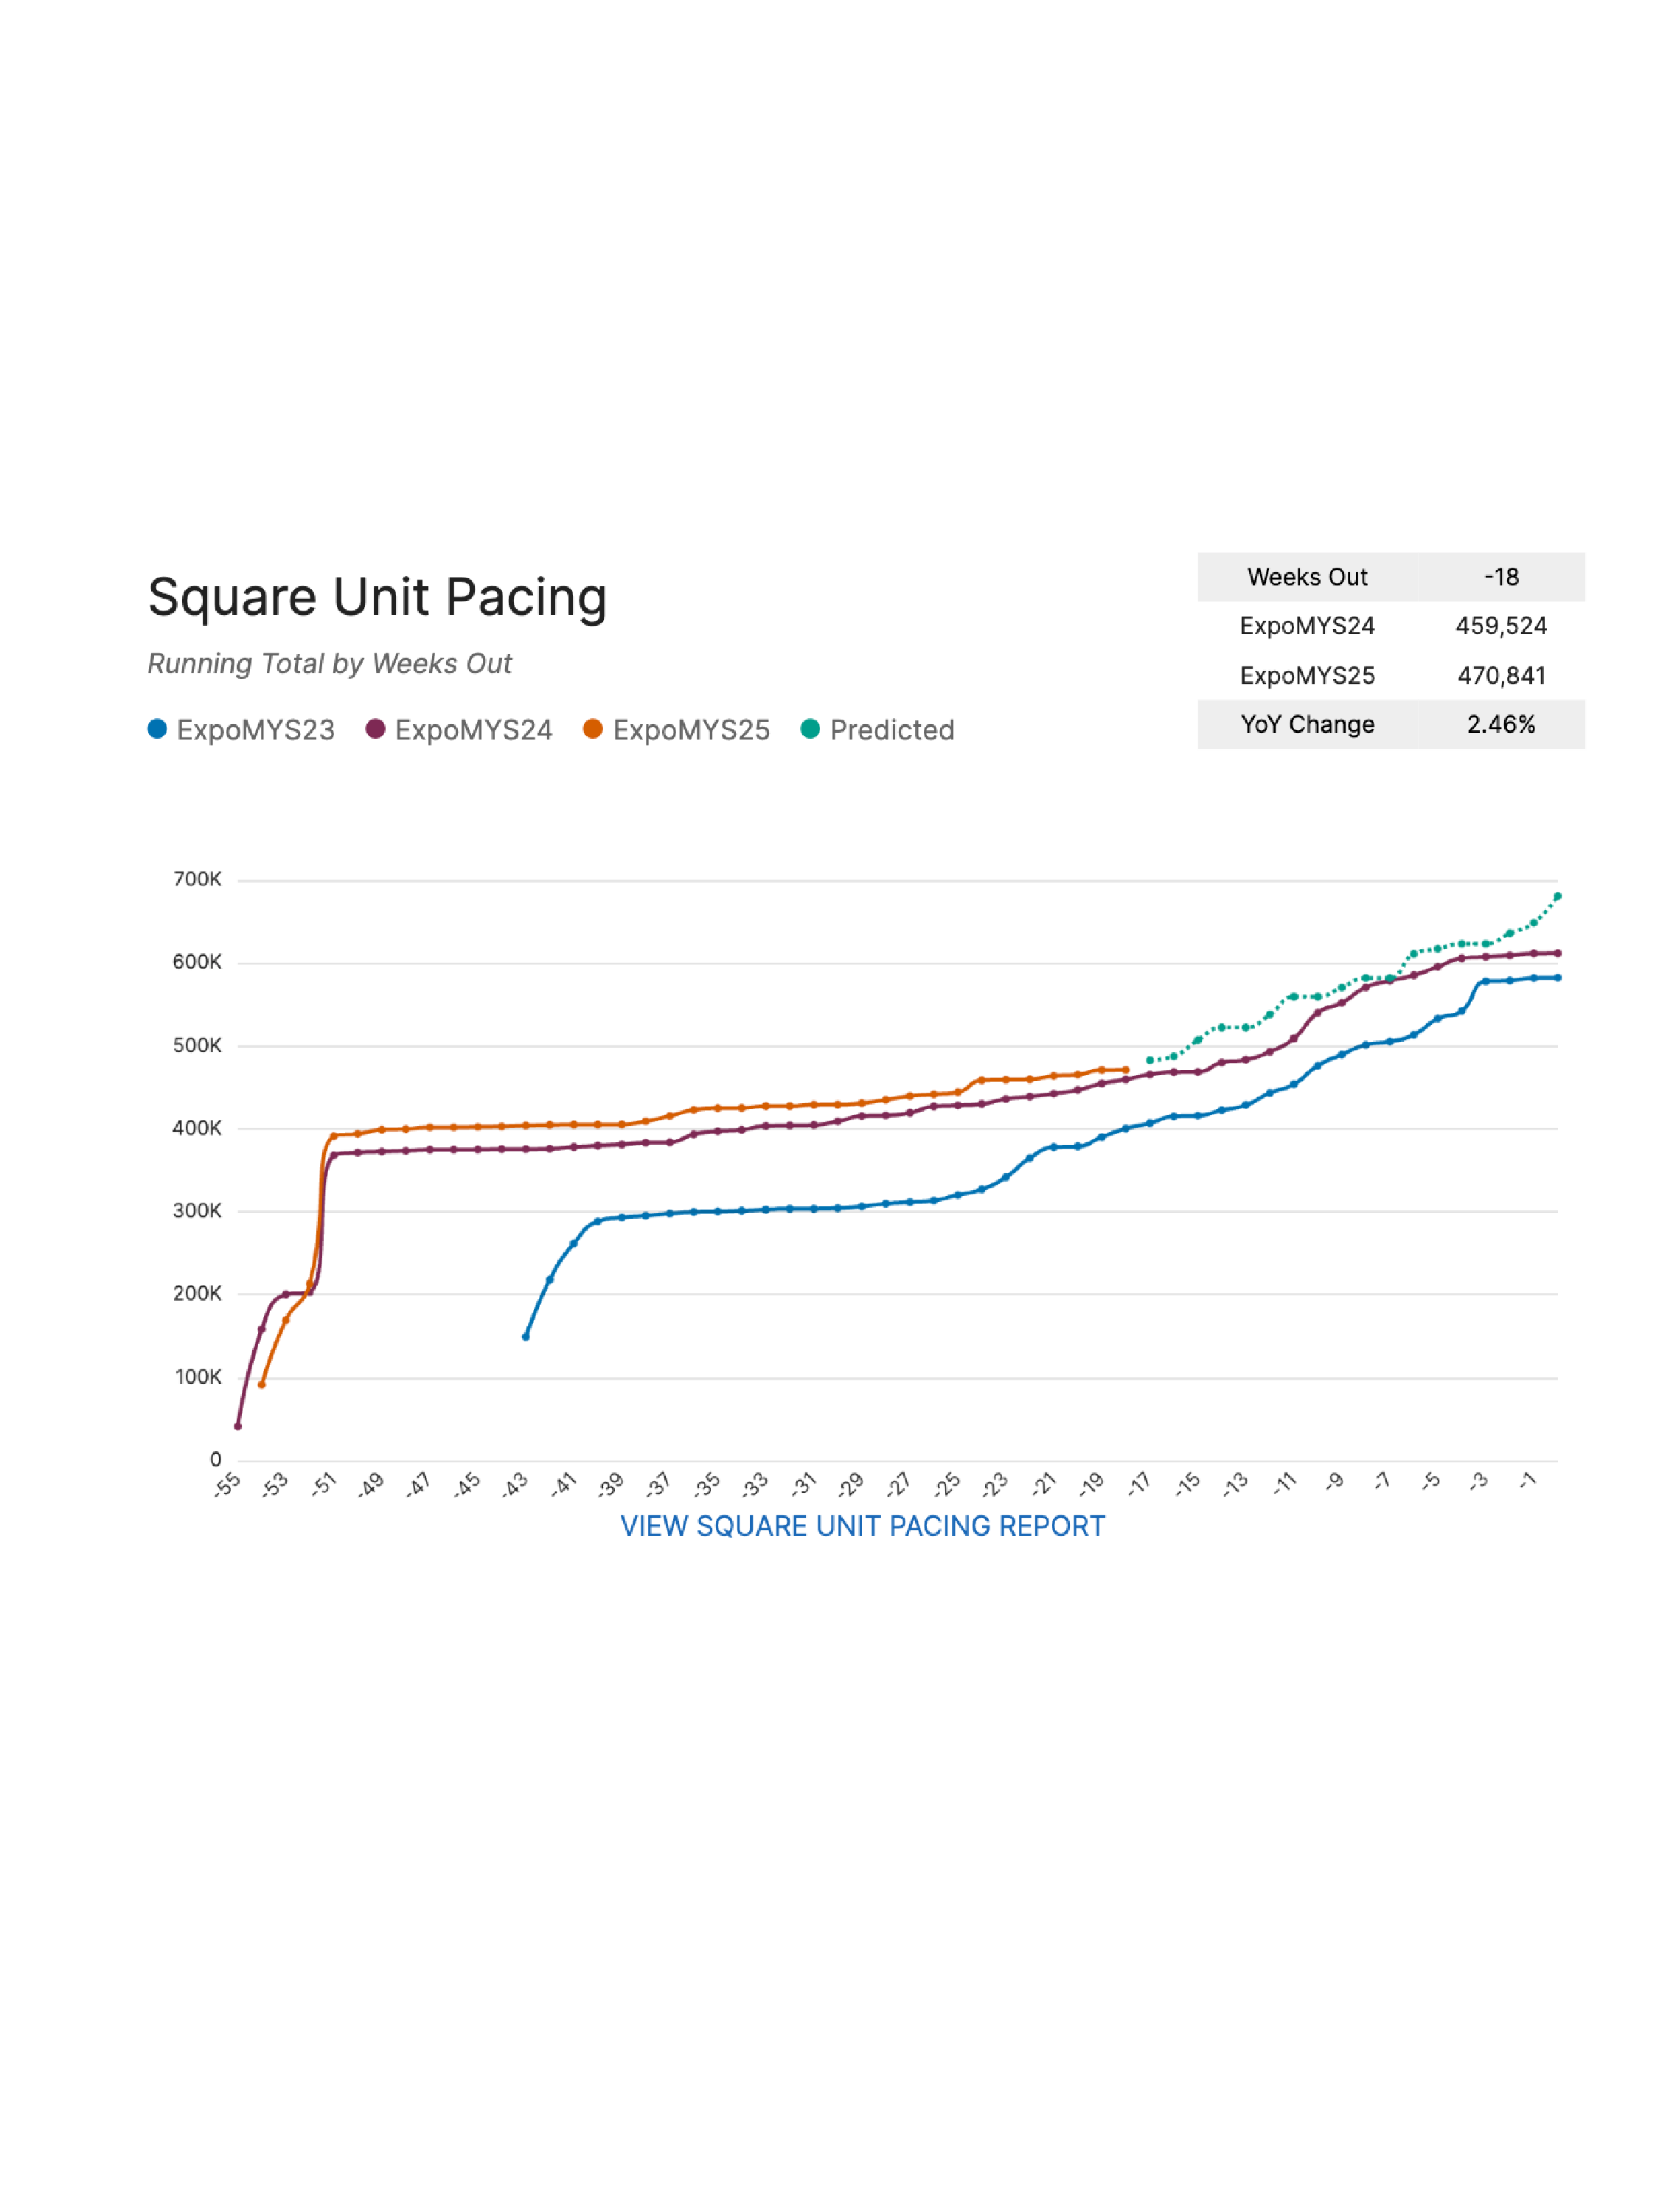
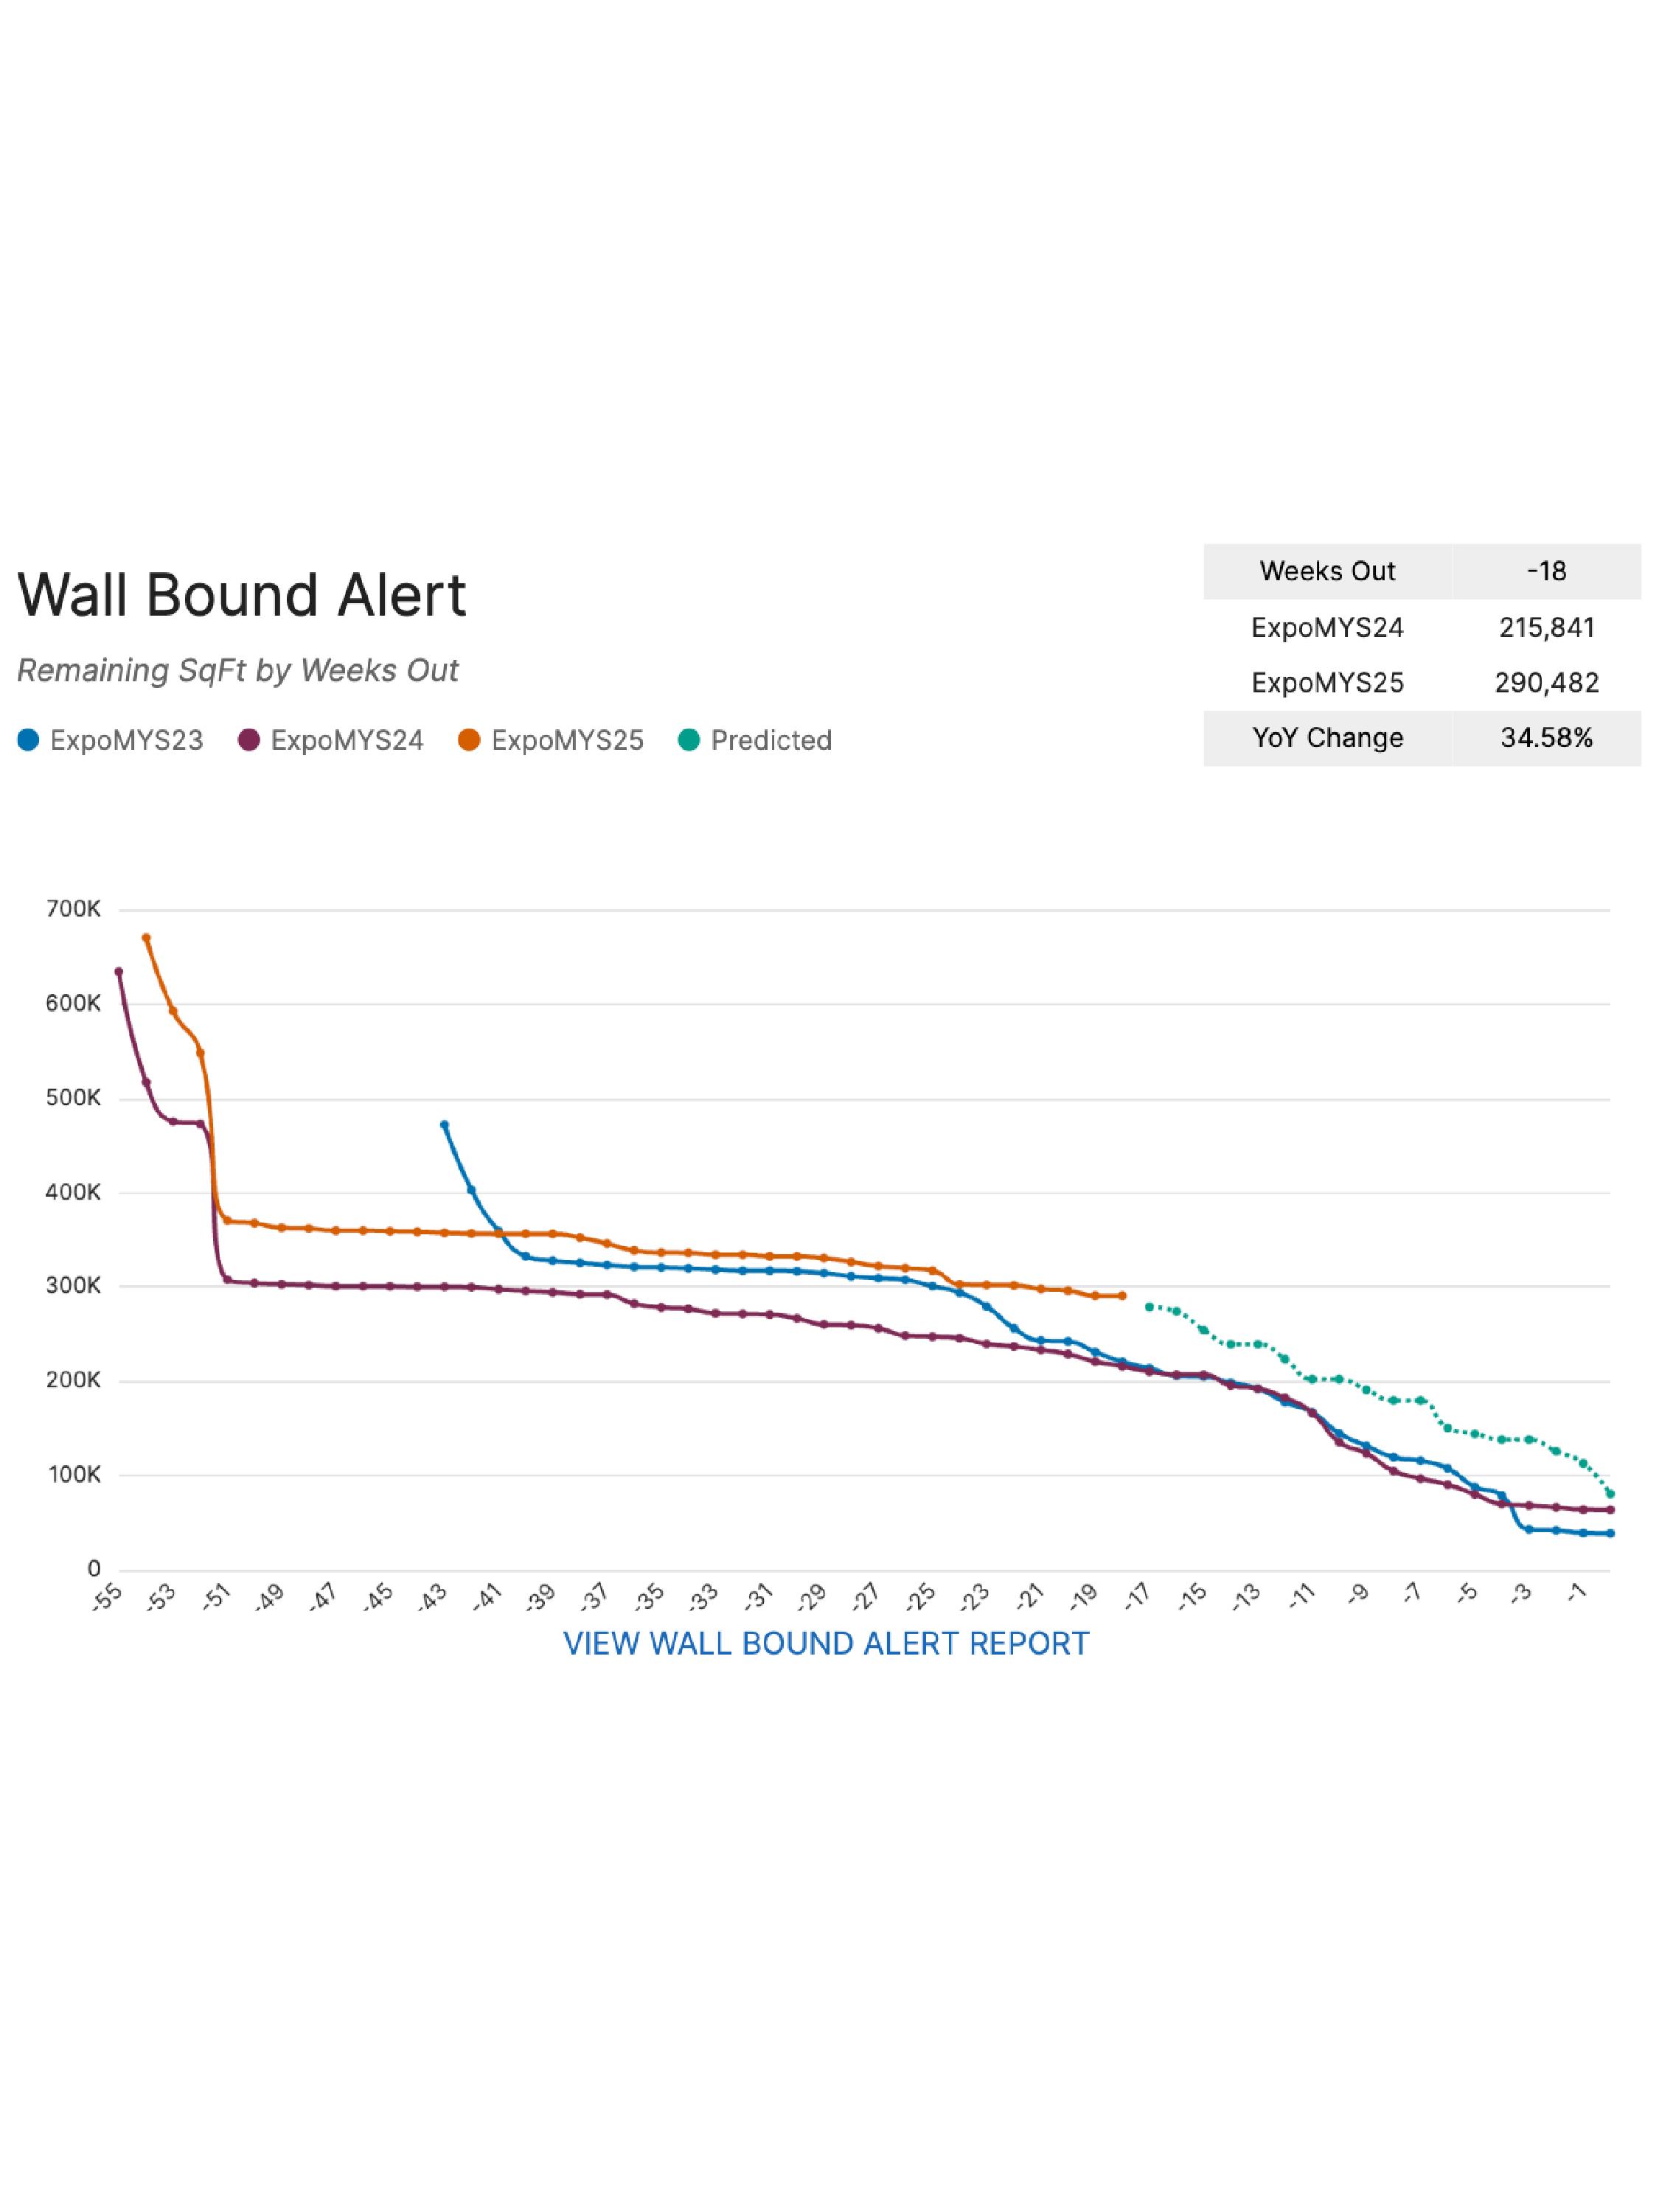
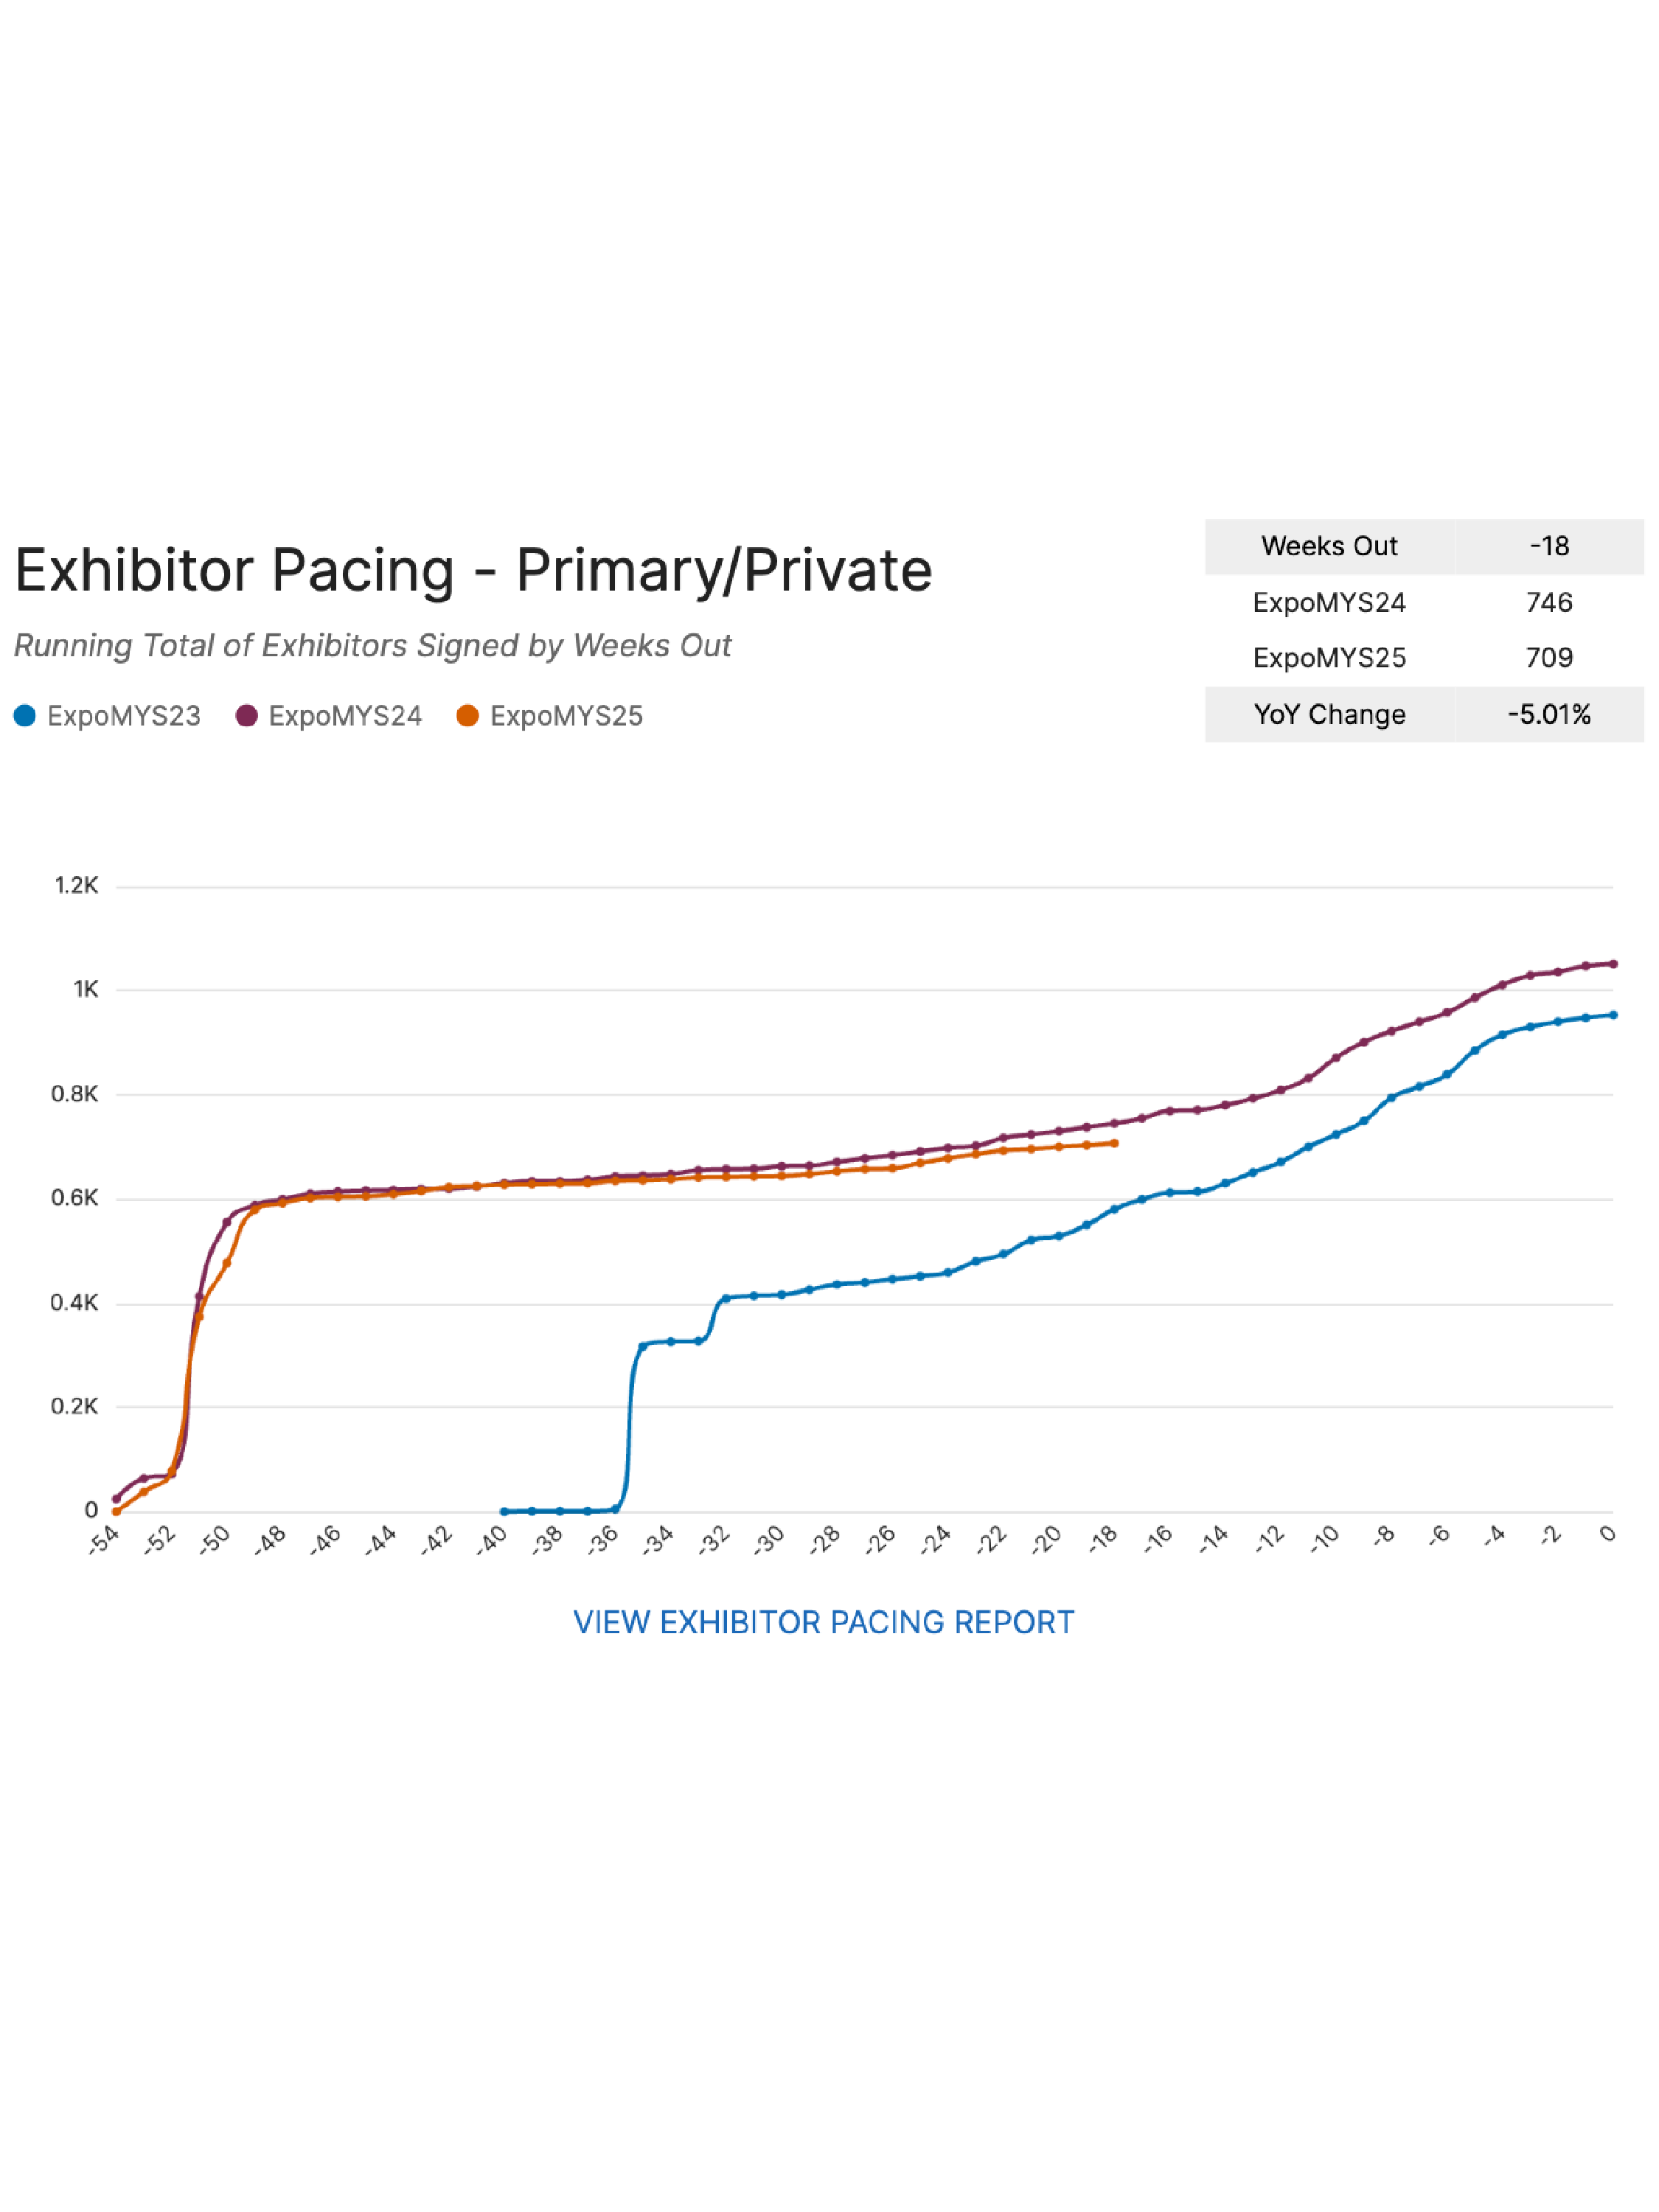
Predictive Financial Pacing
Using machine learning models and external market indices, MYS Insights forecasts the financial outcomes of your event with a high degree of accuracy.
_4.png?width=600&height=338&name=Storyboard%20-%20MYS%20Insights%20(1)_4.png)

Turning Exhibitors into Your Strongest Event Marketing Asset

Monthly Product Pulse: March 2025